Rampion Visitor Centre – A borderless view of green energy.
Rampion Visitor Centre is one of the UK’s newest visitor attractions dedicated to exploring the benefits of green energy. The centre provides an educational experience, where people of all ages can discover how electricity works, and explore the relationship between electricity and climate change. Their goal is to inspire visitors to make positive changes in reducing their own carbon footprint.
The exhibition needed an element that would engage audiences and emphasise the importance of green energy for countering the consequences of climate change. An unforgettable source of interaction was what they were looking for from Pufferfish.
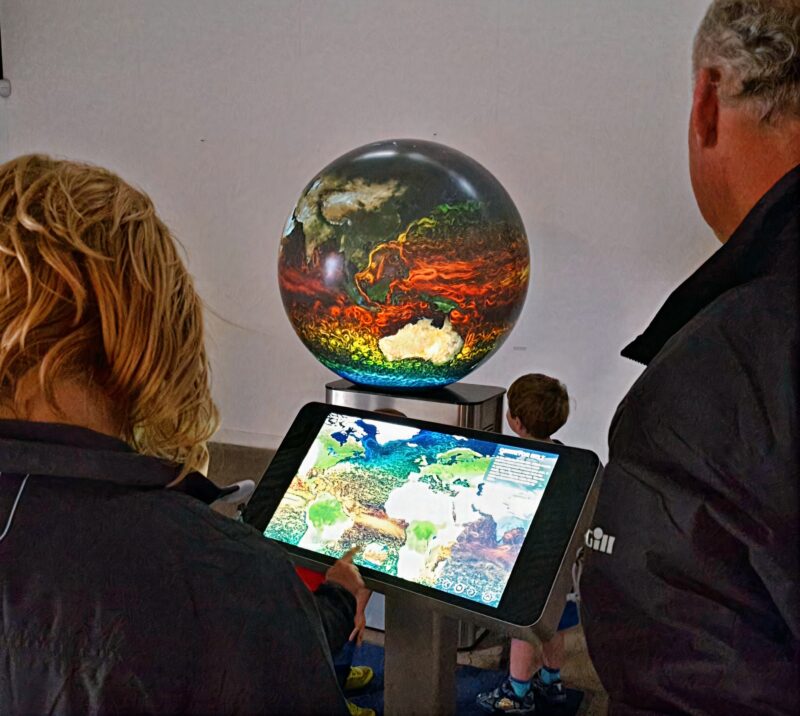
The PufferTouch, the world’s leading touch-enabled spherical display, became the foundation for the visitor experience, examining the process and innovations behind wind energy. Allowing visitors to interactively explore the development, construction and operation of Rampion, showing how energy is made and how wind energy works. Crucially the spherical display visualises how contributors to climate change like transportation, population growth, and energy consumption impact the planet.
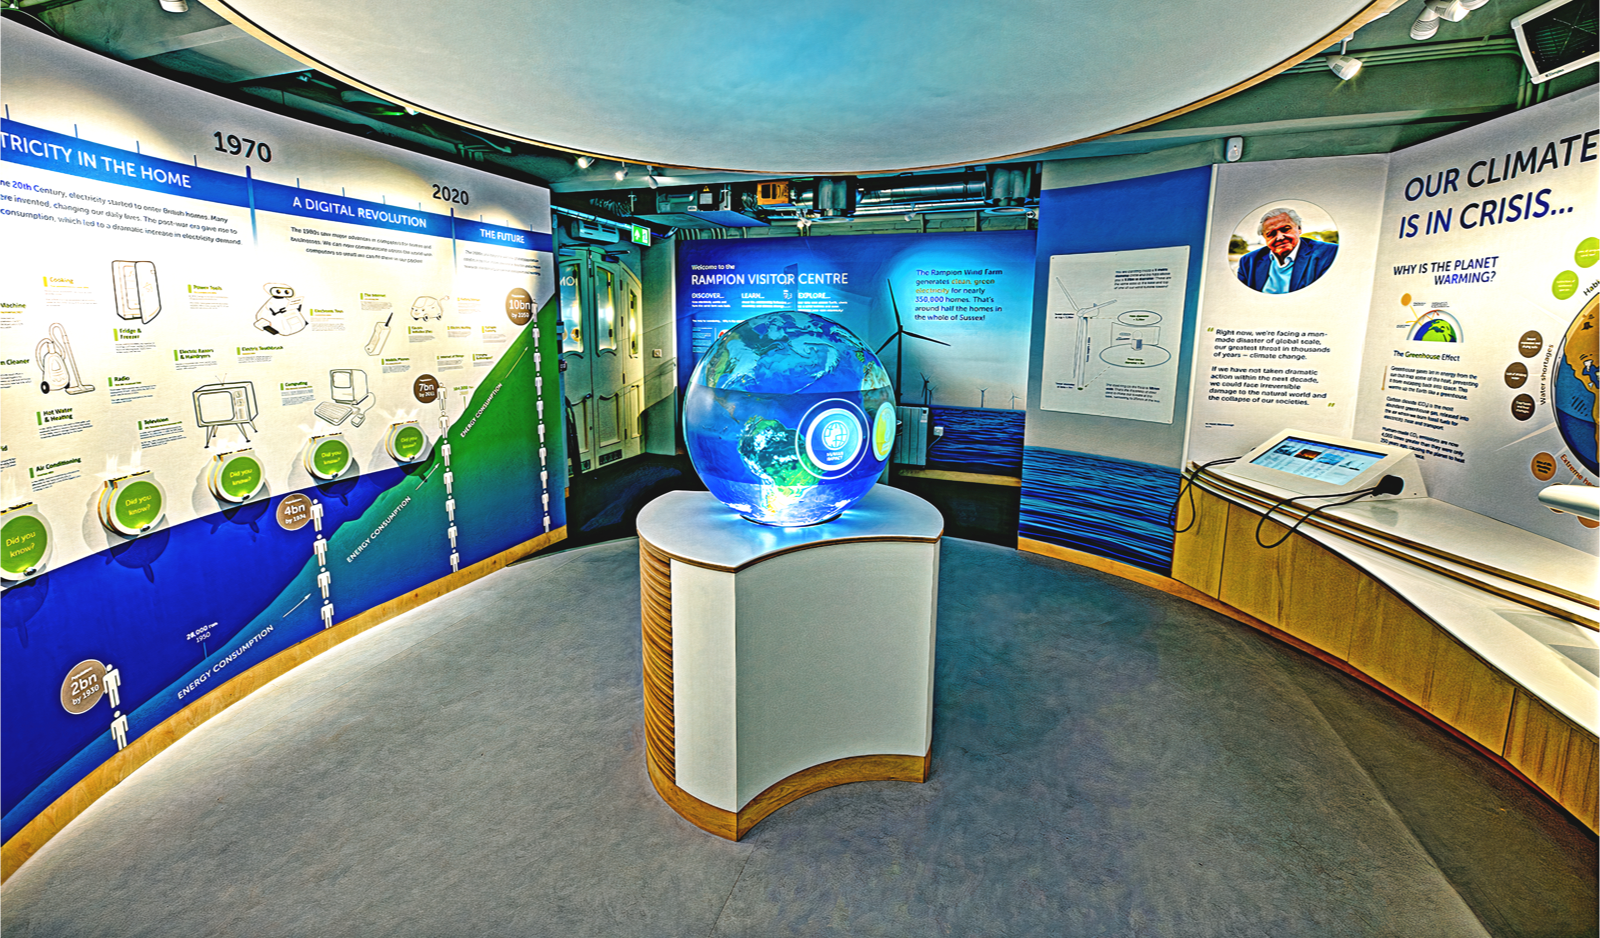
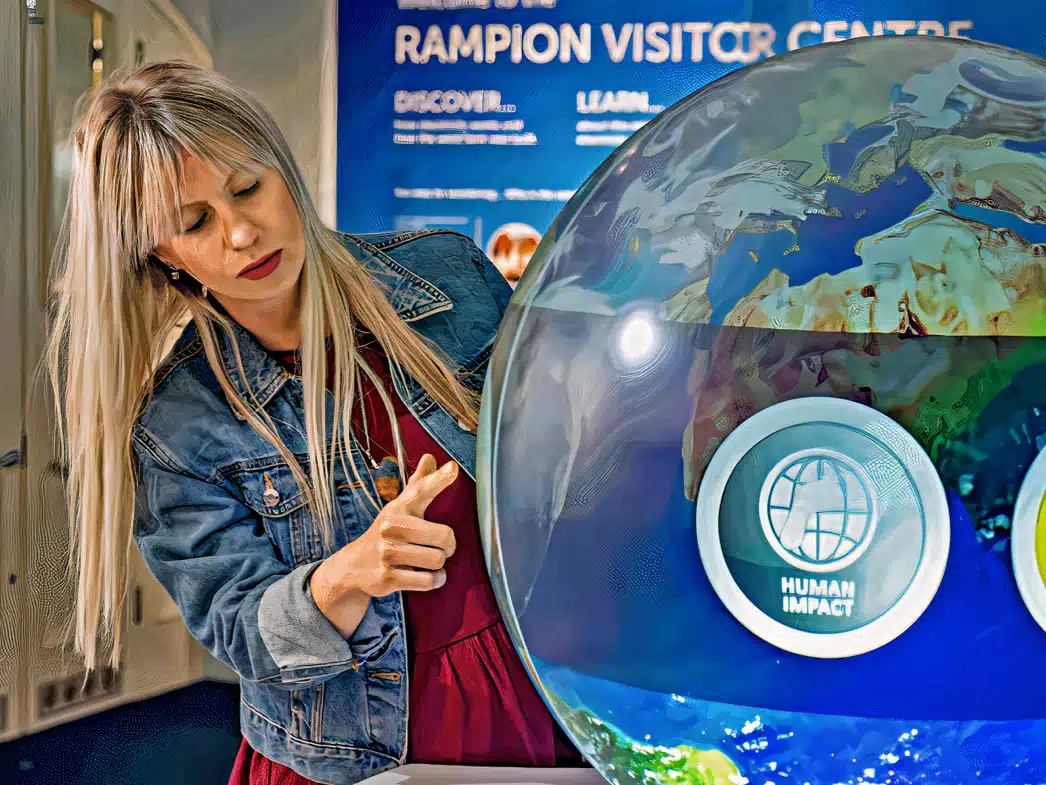
Academic research shows that spheres hold the attention of their audiences, and people tend to orbit around them to view all the content available, often returning as content is refreshed. Rampion Visitor Centre capitalised on this knowledge to increase dwell time and better communicate their message, through using a PufferTouch.